China Top 10 Solar Power Providers for Global Buyers
China’s solar manufacturing base has become central to the global energy transition. The International Energy Agency’s Renewables 2024 report expects global renewable capacity to expand by nearly 5,500 gigawatts between 2024 and 2030. China is projected to deliver almost 60% of that growth.
The scale is remarkable. It is also easy to misunderstand.
IRENA’s Renewable Capacity Statistics 2025 recorded 1,865 gigawatts of global solar photovoltaic capacity at the end of 2024. Chinese manufacturers support this market through modules, inverters, mounting systems, storage, and engineering services. However, production volume alone cannot identify reliable solar power providers. Global buyers must examine factory consistency, product certifications, warranty terms, financial strength, delivery records, and after-sales support.
Fatih Birol, Executive Director of the International Energy Agency, described solar PV and wind as “the new electricity superpowers.” His statement reflects market momentum, but procurement still requires careful judgment. A low quoted price may hide logistics risks, unclear degradation guarantees, or limited technical support. A famous brand may also be unsuitable for a specific climate or project design.
This guide introduces China’s top 10 solar power providers for global buyers. It compares their technologies, export experience, manufacturing capabilities, and practical buyer considerations. The ranking should not be treated as permanent. Company performance, policies, component quality, and regional service networks change. Public data can also be incomplete.
That uncertainty matters. Buyers should verify every claim through technical documents, independent testing, reference projects, and direct supplier communication. The strongest provider is not always the largest. It is the one that can perform reliably from factory floor to operating site.
China’s 2023 PV Scale: Over 609 GW of Installed Solar Capacity
China Top 10 Solar Power Providers for Global Buyers
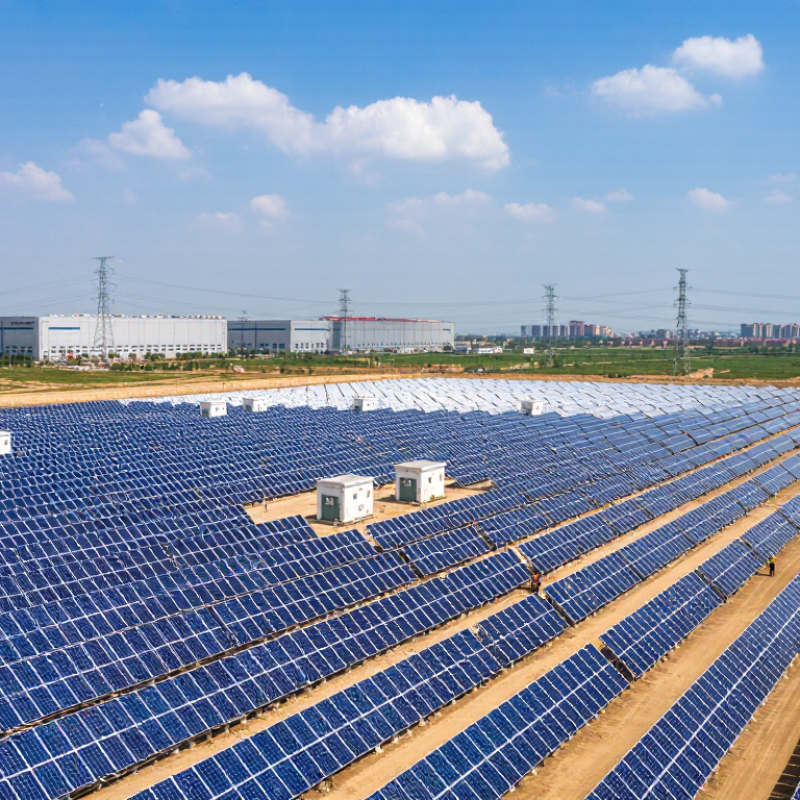
China’s solar market reached more than 609 GW of cumulative installed photovoltaic capacity by the end of 2023. The figure was reported by China’s National Energy Administration and reflects rapid expansion across utility-scale and distributed projects. New installations added in 2023 exceeded 200 GW, showing how quickly manufacturing, construction, and grid connections have developed.
That changes procurement. Global buyers can access modules, inverters, mounting systems, and engineering services at significant scale. Yet installed capacity does not automatically prove product quality or supplier reliability. Buyers should examine factory audits, product test reports, warranty terms, shipment records, and compliance with destination-market requirements. Traceable materials and stable after-sales support also matter, especially for projects expected to operate for 25 years or longer.
Numbers need context. A large national total may hide regional transmission limits, curtailment risks, or delays in connecting new projects. Product performance can also vary between production batches. Buyers should request independent verification, sample testing, and clear documentation before signing contracts. Price remains important, but an unusually low quotation may reflect weaker service, uncertain components, or limited protection after delivery. Providers serving international customers should communicate technical data clearly and handle changing certification rules responsibly. The market is powerful, though not flawless. That distinction deserves attention.
Ranking Metrics: Shipments, Efficiency, Bankability, and 25-Year Warranties
China Top 10 Solar Power Providers for Global Buyers
A credible top-10 ranking needs more than shipment volume. Shipments reveal manufacturing scale and market acceptance. However, large exports can hide regional concentration or short-term demand. Buyers should cross-check shipment records, project references, and delivery consistency.
Efficiency requires careful testing. Compare module efficiency, temperature coefficients, degradation rates, and performance under weak light. Laboratory figures are useful, but field conditions are harsher. Dust, heat, shading, and installation quality can reduce annual output. Field reality differs. Independent test reports and operating data provide stronger evidence than brochures.
Bankability measures whether a supplier can support a project for decades. Review audited financial statements, warranty reserves, insurance coverage, and the company’s service network. A 25-year warranty sounds reassuring, yet its terms need close reading. Check whether it covers product defects, performance loss, labor, transport, and claim deadlines. Some warranties protect output but exclude practical replacement costs. That matters. No ranking is perfect, because pricing, technology cycles, and policy conditions change quickly. A transparent scoring model should show its evidence, weighting, and limitations. This approach helps global buyers compare dependable supply with measurable long-term risk.
China Top 10 Solar Power Providers for Global Buyers
Ranking metrics: shipments, module efficiency, bankability, and 25-year warranties
The chart presents anonymized benchmark scores for ten leading Chinese solar suppliers. Scores are normalized from 0 to 100 using publicly reported shipment ranges, commercial module efficiency specifications, financeability assessments, and standard product-warranty terms. A 25-year warranty is treated as the full warranty benchmark.
Top 10 Providers: Comparing Global Deliveries and Manufacturing Capacity
A practical review of China’s top ten solar power providers should examine deliveries and manufacturing capacity together. A large factory does not always mean reliable global supply. Some providers operate several module plants, while others depend on partner facilities during peak demand.
Export records show different strengths across regions. Several providers ship heavily to Europe and Southeast Asia. Others maintain stronger routes into the Middle East, Africa, and Latin America. Delivery performance depends on port access, container planning, product availability, and local compliance documents. Buyers should request recent shipment records, not only annual production claims.
Capacity figures can mislead. A provider may advertise multi-gigawatt capacity, yet its usable output changes with cell supply, factory upgrades, and quality inspections. During procurement checks, I compare factory audit reports, production-line photos, warranty terms, and third-party test results. Traceability matters too, especially when projects cross several jurisdictions. Small documentation gaps can create large delays.
The comparison is not perfect. Public delivery figures often combine residential, commercial, and utility shipments. That makes direct ranking difficult. Still, providers with diversified plants and repeat export experience usually offer steadier scheduling. Buyers should also test communication speed before signing. A fast quotation is useful. A clear answer after a technical dispute matters more.
China Top 10 Solar Power Providers for Global Buyers
Top 10 Providers: Comparing Global Deliveries and Manufacturing Capacity
Data note: Figures are rounded industry estimates for comparison purposes, compiled from publicly disclosed shipment updates, announced production capacity and overseas manufacturing plans. “Provider” labels are intentionally anonymized; capacity figures represent nominal annual capacity and may differ from actual operating output.
Technology Benchmarks: TOPCon, HJT, and BC Modules Exceeding 23% Efficiency
China Top 10 Solar Power Providers for Global Buyers
Technology now separates serious solar sourcing from simple price comparisons. Fraunhofer ISE’s Photovoltaics Report 2024 shows commercial TOPCon, HJT, and back-contact modules exceeding 23% efficiency. A 23.5% module can produce roughly 470 watts across two square metres under standard test conditions. That matters on crowded rooftops, where every square metre has a job.
TOPCon usually offers strong efficiency with mature production lines. HJT performs well in hot conditions, supported by a lower temperature coefficient.
BC modules place contacts behind the cell, improving front-side light capture and appearance. The 2024 International Technology Roadmap for Photovoltaic forecasts rapid growth for n-type technologies, but factory capability still varies.
Datasheets can look perfect. Field results may not.
Tips: Compare verified module test reports, not only marketing efficiency. Check temperature coefficients, bifacial ratings, annual degradation, mechanical-load testing, and independent certification. Ask for recent third-party measurements from accredited laboratories. Also review shipment consistency and replacement procedures. The IEA PVPS Trends report notes continuing pressure on module prices, yet lower cost can hide thinner margins for quality control. I would not choose a 23% module from a single headline number. Humidity, dust, salt, and weak installation practices can erase theoretical gains. A small data gap can become a large energy loss.
Buyer Verification: IEC 61215, IEC 61730, Traceability, and Service Coverage
For global buyers comparing China’s top solar power providers, certification is a working document, not a decorative badge. Ask for current IEC 61215 and IEC 61730 certificates, test reports, and the exact module model covered. Check. A certificate may cover one design, while a quotation names another. That mismatch deserves written clarification before any deposit or production release.
During supplier audits, buyers should trace a panel from wafer records to carton label and final serial number. Useful evidence includes batch records, incoming-material logs, factory test data, and retained samples. Scan the code. It should connect to production dates, component lots, and inspection results. Traceability is strongest when records remain readable and independently reviewable after shipment. Some databases look impressive but lack complete links. That is a weakness, not a technical detail.
Service coverage also needs verification. Request regional contacts, response targets, spare-parts arrangements, and a clear process for damaged or underperforming modules. Ask who pays for inspection and transport. Do not rely on “global support” alone. Test the support channel with a practical pre-sales question; slow replies often predict later friction. I would also record every promise in the contract, although this step is easy to neglect. Even strong documents cannot replace sample testing, factory visits, and careful follow-up. The uncomfortable truth: supplier rankings change, and paperwork can age faster than equipment.